Do wealthier drivers cut more at all-way stop intersections?
An observational study of 759 drivers navigating 46 intersections across Southern California
Does an individual’s socioeconomic status (SES) predict their tendency toward unethical behavior? If so, who is more likely to behave unethically—the rich or the poor? Pop culture abounds with depictions of each. For example, Walter Hill’s cult classic The Warriors (1979; see Figure 1) features numerous violent confrontations between New York City street gangs. This depiction is consistent with the idea that low SES individuals live in environments in which resources are relatively scarce, and so must lie, cheat, steal—and in some cases even kill—to survive.
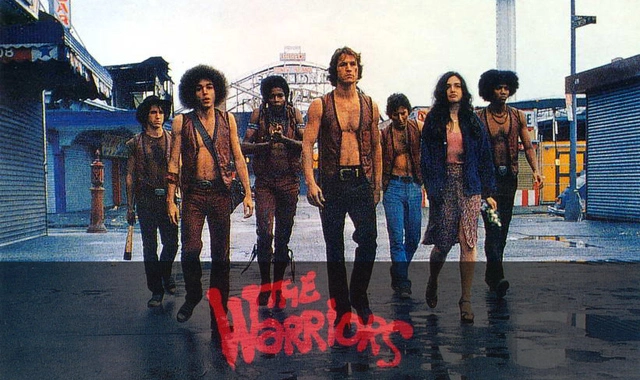
Figure 1: The eponymous street gang from The Warriors (1979).
Alternatively, consider Gordon Gekko from Oliver Stone’s Wall Street (1987; see Figure 2). Gekko commits insider trading in order to take over a company, fire its employees, and then raid their pension plan for his own benefit. Gekko’s “greed is good” philosophy is consistent with numerous examples of real-world unethical behavior among high SES individuals: bankers dupe their clients into participating in investment schemes they know are doomed to fail,1,2 CEOs embezzle millions to fund lavish lifestyles3, and companies attempt to increase their profitability by illegally harming the health and well-being of thousands.4

Figure 2: Gordon Gekko from Wall Street (1987).
Are wealthier individuals more prone to unethical behavior?
While empirical evidence bearing on the relationship between SES and unethical behavior is sparse, recent results from Piff and colleagues5 demonstrate a positive association between the two. Across seven studies, the authors found that high SES consistently predicted increased unethical behavior. The very uniformity of the effect however, has suggested to some that the results shouldn’t be believed. For example, Francis6 found that most of the Piff et al. studies had only about a 50% chance of finding a statistically significant effect. Given this power, the likelihood of getting significant results across all seven studies is quite low—around 2%. To account for this discrepancy, Francis argues that Piff et al. “may have (perhaps unwittingly) run, but not reported, additional experiments that failed to reject the null hypothesis (the file drawer problem), or they may have run the experiments in a way that improperly increased the rejection rate of the null hypothesis.”
Replicating and extending Piff et al.’s Study 1
The best way to address Francis’ critique is via independent replication. The present work initiates this effort by attempting to replicate and extend Piff et al.’s Study 1. We focus on this particular study because it offers a compelling real-world demonstration of the relationship between SES and unethical behavior, and also because there are plausible explanations for the behavior of high SES participants that are largely unexplored in Piff et al., but that we attempt to address here.
In Study 1 Piff and colleagues observed 274 drivers as they navigated a single all-way stop intersection in the San Francisco Bay Area. Driver SES was indexed by estimating the value of drivers’ vehicles. Piff et al. found that those driving more expensive vehicles were more likely to illegally cut at the intersection—that is, they were less likely to wait their turn in the queue that formed as cars pulled up to the intersection, as required by California Vehicle Code.7 Why are high SES drivers more likely to cut? While Piff et al. acknowledge that the relationship between SES and unethical behavior is complex, their central argument across all seven studies is that wealthier individuals entertain more positive attitudes towards greed. This contributes to behaviors like lying during business negotiations (Study 5), and cheating at for-profit games (Study 6). But while greed offers a relatively straightforward account of unethical behaviors that result in material gain, it seems ill-suited to explain cutting at all-way stop intersections, where drivers seem to be accruing nothing more than mere seconds. The present work explores an alternative account of the relationship between SES and illegal cutting behavior.
Could high SES cutting be accidental?
One interpretation of Piff and colleagues’ Study 1 is that increased cutting among high SES drivers reflects their ethics. Wealth is associated with increases in self-interested behavior8 and reduced compassion.9 These traits may lead high SES drivers to prioritize their own desire to quickly navigate intersections over both fairness to other drivers, and the law.
Alternatively, it may be that cutting has very little to do with ethics. Instead, high SES drivers may be more prone to accidental cutting due to SES-related differences in attention, as outlined in the following section. Differentiating cutting that is accidental from cutting based on ethics is important because it bears on a driver’s culpability: many ethical and legal systems assign reduced culpability in the case of accidental law-breaking—e.g., the difference between murder and manslaughter.10
How might higher SES drivers accidentally cut? Navigating all-way stop intersections requires attention to other drivers in order to determine whose turn it is to proceed. Momentary lapses of attention can cause drivers to lose track of their place in the queue, which leads to accidental cutting if they happen to go through the intersection at the wrong time. Here we suggest that high SES drivers might be more likely to cut accidentally because they devote less attention to other drivers.
Revisitng Piff et al.’s Study 1
The asymmetry in attention to others among high versus low SES individuals might affect cutting behavior in a way that leads to accidental high SES cutting. This provides an alternative account of the results from Piff et al.’s Study 1, as illustrated in Figure 3.

Figure 3: Predictions from an attentional account of the relationship between driver SES and cutting behavior at all-way stop intersections. P(Cut) is the probability of cutting.
I assume that that cutting is more common under heavy traffic conditions. When additional vehicles appear in more of the lanes entering an intersection, it becomes increasingly difficult to keep track of one’s place in the queue. Losing track of one’s place leads to accidental cutting. This assumption, combined with worse attention to others among higher SES drivers, predicts the interaction pattern shown in Figure 3, in which the effect of driver SES is more pronounced under heavy traffic conditions.
The dashed gray line in Figure 3 represents the results from Piff et al.’s Study 1. Since Piff et al. did not keep track of traffic, it’s possible that their results were generated by combining data from heavy and light traffic conditions, as represented by Figure 3’s red and blue lines, respectively. If this is what really occurred, it undermines the conclusion that the behavior of higher SES drivers is due to ethically non-normative behavior. Instead, accidental cutting becomes a possibility. Note that the blue line in Figure 3 is flat—low and high SES drivers cut at the same rate when traffic is light and attentional demands are low. In contrast, when traffic is heavy there are more attentional demands, which results in more cutting among higher SES drivers. Crucially, this pattern of cutting would be consistent with a purely attentional account: higher SES drivers cut more not because they place their own interests above those of other drivers, but because they devote less attention to other drivers are are therefore more likely to lose their place in the queue and cut accidentally.
Finding out what drivers do under light traffic conditions is key for discriminating between the attentional and ethics-based hypotheses. If the effect of SES on cutting is largely limited to heavy traffic conditions, this would bolster the attentional account. However, if there is an effect of SES on cutting in light traffic—where attentional demands are low—this would be consistent with the idea that higher SES drivers cut more than lower SES drivers because they don’t really care about the rules, or disadvantaging other drivers.
The present study
The present work addresses a serious critique of Piff and colleagues leveled by Francis. It does so by attempting to replicate Piff et al.’s finding of a positive correlation between SES and illegal cutting behavior at all-way stop intersections. In addition, while it is relatively common to assume that unethical behavior among wealthier individuals is related to ethical shortcomings, here we investigate the possibility that high SES cutting might instead be accidental in that it reflects class-based differences in attention.
Methods
Coders
Thirty-five undergraduate students at the University of California, San Diego were trained to code vehicle values using the same five-point scale found in Piff et al.: 1 = cars worth $3,000 or less; 2 = $3,001-$10,000; 3 = $10,001-$25,000; 4 = $25,001-$40,000; 5 = cars worth more than $40,000. Vehicle value is a reliable predictor of SES.15
Procedure
Coders positioned themselves unobtrusively at all-way stop intersections. For example, they sat at bus stops, in parked cars, or feigned phone conversations. Coders pseudo-randomly selected approaching vehicles for coding, with the constraint that vehicles approaching empty intersections were not selected, and commercial vehicles were not selected. Prior to stopping, the estimated value of each selected vehicle was recorded using the vehicle value scale described above, and the amount of traffic was measured—i.e., coders noted the number of lanes in the intersection in which other cars were already queued (see Figure 4). Coders then observed whether drivers waited their turn before proceeding through the intersection, or whether they jumped the queue and cut off other drivers, in violation of California Vehicle Code. As drivers pulled away, their perceived sex and age (1 = 16-35 years old; 2 = 36-55; 3 = 56 and older) were recorded, as well as the time of day.
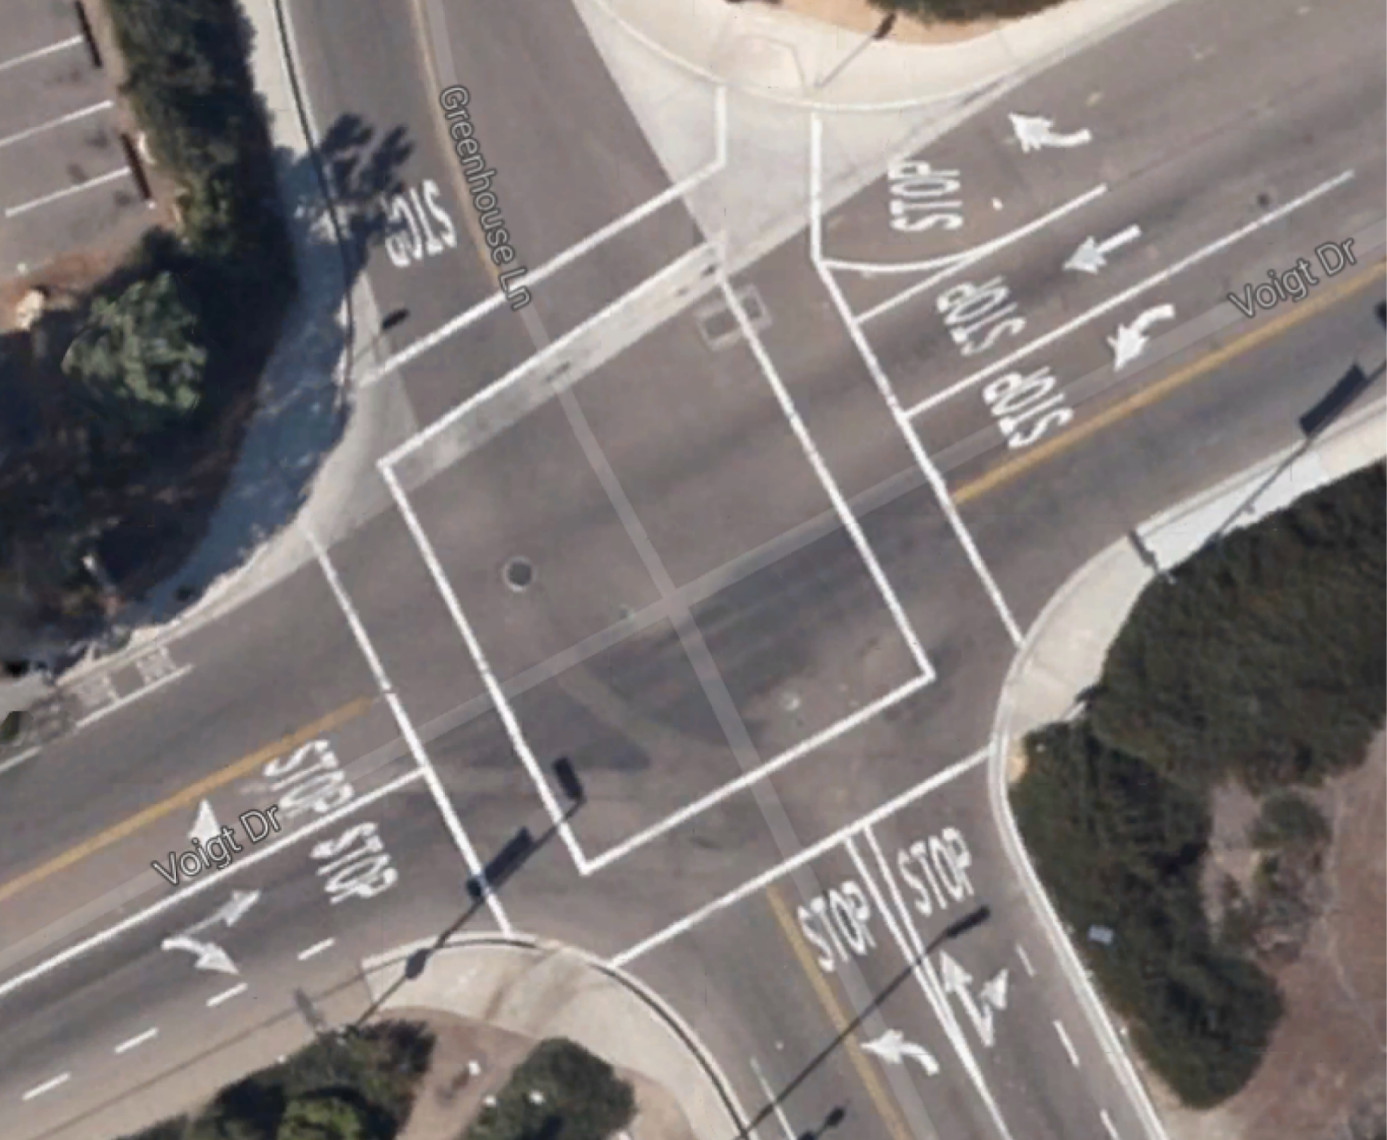
Figure 4: One of the intersections observed in the study was at Voight and Gilman in La Jolla, California. Lanes entering the intersection are marked with the word STOP. The amount of traffic that drivers dealt with was quantified as the number of lanes that were already occupied by other vehicles as drivers approached. For example, if there were vehicles waiting in two other lanes as a driver approached, then traffic was coded as two. Image courtesy of Google.
Bayesian hierarchical logistic regression was used to model the relationship between vehicle value and cutting.16,17,18 The clustering of datapoints by coder and intersection was taken into account by modeling coder and intersection as random effects with the maximal random effects structure.19 The main predictor variables of interest were vehicle value, traffic, and their interaction, with traffic recoded as heavy versus light to simplify presentation of the results (heavy: traffic values of three or more; light: traffic values of one or two). Covariates included driver sex, driver age, and time of day.
Results
778 drivers were observed at 46 all-way stop intersections. 88% of the data were collected in San Diego County, 8% in Los Angeles County, and 4% in Orange County. Nineteen of the 778 drivers, accounting for 2.4% of the data, were excluded from analysis, either because they were not visible enough to record their sex and age, or because it was not possible to definitively determine whether a cut had occurred (e.g., due to pedestrians or cyclists disrupting the queue). This left analyzable data from 759 drivers.
The overall data pattern is illustrated below in Figure 5. Drivers of higher value vehicles cut more than drivers of lower value vehicles, B = 0.24, 95% CrI [0.05, 0.46]. Drivers cut more under heavy traffic conditions, B = 0.52, 95% CrI [0.08, 0.96]. And while the interaction of vehicle value and traffic was not credibly different from zero at the 95% level, B = -0.29, [-0.66, 0.07], it was at the 88% level, [-0.58, -0.01]. All other effects were null.

Figure 5: Probability of cutting as a function of vehicle value and traffic. Lines represent predicted means. Shading shows 95% credible intervals.
Two additional models were fit in order to follow up on the interaction of vehicle value and traffic. The light model was based on data from the light traffic condition only (the blue line in Figure 5). Results from the light model demonstrate that drivers of higher value vehicles cut more than drivers of lower value vehicles under light traffic conditions, B = 0.38, 95% CrI [0.12, 0.67]. In contrast, the heavy model—which was based on data from the heavy traffic condition only (the red line in Figure 5)—showed a null effect of vehicle value on cutting, B = 0.08, 95% CrI [-0.22, 0.36].
Discussion
In the present work, 759 drivers were inconspicuously observed as they navigated all-way stop intersections in Southern California. Coders rated the value of drivers’ vehicles and noted whether they waited their turn in the queues that formed at intersections, or illegally cut. The results demonstrate that drivers of more expensive vehicles were more likely to cut than drivers of less expensive vehicles, even when statistically accounting for the contributions of traffic, driver sex, driver age, and time of day. This replicates Piff et al.’s finding of a positive correlation between driver SES and cutting, and undercuts Francis’ suggestion that the Piff et al. results are spurious.
The present findings build on Piff et al.’s work in two important ways. First, the results demonstrate that the outcome of Piff et al.’s Study 1 was not determined by the particular drivers or intersection studied. We show that the relationship between driver SES and cutting generalizes to a much larger sample of drivers (759 vs. 274) navigating a much larger set of intersections (46 vs. one) in a different geographic region of the country (Southern California vs. the San Francisco Bay Area).
Second, the present work provides a more detailed investigation of the socio-cognitive mechanisms that might account for driver behavior at all-way stop intersections. Piff et al. emphasized the role that attitudes towards greed play in contributing to an array of unethical behaviors. But while the greed hypothesis is well-suited to explaining unethical behavior in the pursuit of material gain, its ability to account for cutting—which does not straightforwardly result in material gain—is questionable. Instead, we hypothesized that higher SES cutting might be accidental, and outlined an account in which it tends to be especially prevalent under high traffic conditions (see Figure 3): higher SES drivers are able to keep track of the simpler queues that form in light traffic, but fail to devote adequate attentional resources to keeping track of the more complex queues that form in heavy traffic. They essentially lose their place in heavy traffic queues, and are thus more likely to cut accidentally.
While we did find evidence of an interaction between driver SES and traffic (see Figure 5), it did not match the predictions of the accidental cutting hypothesis. Crucially, the accidental cutting hypothesis asserts that there should be a weaker effect of SES on cutting in light traffic, because light traffic queues are simpler, and the amount of attention that higher SES individuals devote to other drivers in the queue is sufficient to successfully track simpler queues. Instead however, we found that the only reliable effects of SES on cutting occurred when traffic was light.
What might account for this data pattern? Regarding the light traffic results, it might be possible to save an attentional account by claiming that even the presence of vehicles in one or two other lanes is enough to outstrip the attentional resources that higher SES drivers devote to tracking the queue. But such a move would strain credulity, since it would in effect be claiming that subtle class-related differences in attention to others lead to large behavioral differences, even on relatively simple tasks like keeping track of one’s place in a queue with only two other people. A more straightforward conclusion is that increased cutting among higher SES individuals is not accidental. Rather, it reflects the increased self-interest and reduced compassion found in other studies. Higher SES drivers seem to be violating ethical and legal norms because it allows them to do what they want to do: navigate through an all-way stop intersection a little bit faster.
The shape of the vehicle value-by-traffic interaction is unexpected and merits further study. Lower SES drivers show traffic effects, whereas higher SES drivers do not. One way to interpret these results is that higher SES drivers are already at ceiling when it comes to cutting—that is, they’re cutting at their maximum rate when traffic is light, so adding additional traffic has no effect. In contrast, lower SES drivers aren’t already at ceiling when traffic is light, hence the increase in cutting under heavy traffic. This account assumes that a ceiling exists—that whether drivers are cutting accidentally or not, there is some maximum level of cutting that they tend to avoid. There may be perfectly natural reasons for such a ceiling. For example, if the rate of cutting were very high (e.g., at 50%) then intersections would become difficult to navigate—one could never predict whether other drivers would obey the queue or cut. What we’re seeing in the present data however, is that intersections seem to function well enough—if not entirely equitably—when lower levels of cutting are present.
To conclude, this study investigated the relationship between unethical behavior and social class by considering a specific type of unethical behavior: cutting at all-way stop intersections. We (1) introduced new data demonstrating that higher SES drivers are more likely to cut than lower SES drivers, (2) argued that high SES cutting does not seem to be accidental, and (3) noted that our results are consistent with other studies showing that higher SES individuals are prone to unethical behavior when attempting to maximize their own self-interest.
Corkery, M., & Protess, B. (2014, August 21). Bank of America papers show conflict and trickery in mortgages. The New York Times. Retrieved from http://www.nytimes.com.↩︎
Johnson, K. (2014, July 14). Citi to pay $7 billion in Justice settlement. USA Today. Retrieved from http://www.usatoday.com.↩︎
Sorkin, A.R. (2005, September 20). Ex-Tyco executives get 8 to 25 years in prison. The New York Times. Retrieved from http://www.nytimes.com.↩︎
Waas, M. (2010, April 23). WellPoint routinely targets breast cancer patients. Reuters. Retrieved from http://www.reuters.com.↩︎
Piff, P.K., Stancato, D.M., Côté, S., Mendoza-Denton, R., & Keltner, D. (2012). Higher social class predicts increased unethical behavior. Proceedings of the National Academy of Sciences, 109(11), 4086-4091.↩︎
Francis, G. (2012). Evidence that publication bias contaminated studies relating social class and unethical behavior. Proceedings of the National Academy of Sciences, 109(25), E1587.↩︎
State of California. (2021). California Vehicle Code. Retrieved from https://leginfo.legislature.ca.gov.↩︎
Piff, P.K. (2014). Wealth and the inflated self: Class, entitlement, and narcissism. Personality and Social Psychology Bulletin, 40(1), 34-43.↩︎
Stellar, J.E., Manzo, V.M., Kraus, M.W., & Keltner, D. (2012). Class and compassion: Socioeconomic factors predict responses to suffering. Emotion, 12(3), 449.↩︎
Numbers 35:16-29. (2001). English Standard Version Bible. Retrieved from https://esv.org.↩︎
Kraus, M.W., Piff, P.K., Mendoza-Denton, R., Rheinschmidt, M.L., & Keltner, D. (2012). Social class, solipsism, and contextualism: How the rich are different from the poor. Psychological Review, 119(3), 546-572.↩︎
Kraus, M.W., & Keltner, D. (2009). Signs of socioeconomic status: A thin-slicing approach. Psychological Science, 20(1), 99-106.↩︎
Kraus, M.W., Côté, S., & Keltner, D. (2010). Social class, contextualism, and empathic accuracy. Psychological Science, 21(11), 1716-1723.↩︎
Fiske, S.T. (1993). Controlling other people: The impact of power on stereotyping. American Psychologist, 48(6), 621-628.↩︎
Frank, R.H. (1999). Luxury Fever: Why Money Fails to Satisfy in an Era of Excess. New York: The Free Press.↩︎
Burkner, P. (2018). Advanced Bayesian multilevel modeling with the R package brms. The R Journal, 10(1), 395-411.↩︎
Stan Development Team. (2021). Stan Modeling Language Users Guide and Reference Manual, Version 2.28. Retrieved from https://mc-stan.org.↩︎
R Core Team. (2021). R: A Language and Environment for Statistical Computing. Vienna, Austria: R Foundation for Statistical Computing.↩︎
Barr, D.J., Levy, R., Scheepers, C., & Tily, H.J. (2013). Random effects structure for confirmatory hypothesis testing: Keep it maximal. Journal of Memory and Language, 68, 255-278.↩︎
Jeremy Boyd
Behavioral & data scientist
I develop evidence-based interventions aimed at improving human developmental outcomes.